The AI measurement organization METR released a report claiming that AI development has accelerated stating:
As of October 2026, Anthropic is likely improving the capabilities of their models on well-specified tasks at around twice the rate they did between March 2024 and October 2025. This estimate is given with high uncertainty; we would not be surprised if the true acceleration was closer to 1.3x or 3x the historical rate.
This is clearly relevant to the discussion of recursive self-improvement: the idea that you can use AI to make your AI better faster. And more broadly relevant to the discussion of AI speed-ups for software engineering in general. And, of course, specifically relevant to the Anthropic IPO coming up. So it’s worthwhile to understand exactly what’s being said here.
When you look into the report you find this 1.9x number is coming from improvements on their AI index. They have this figure which linearly extrapolates measurements of their AI index over time and find that there’s a step change over the previous rate of improvement.
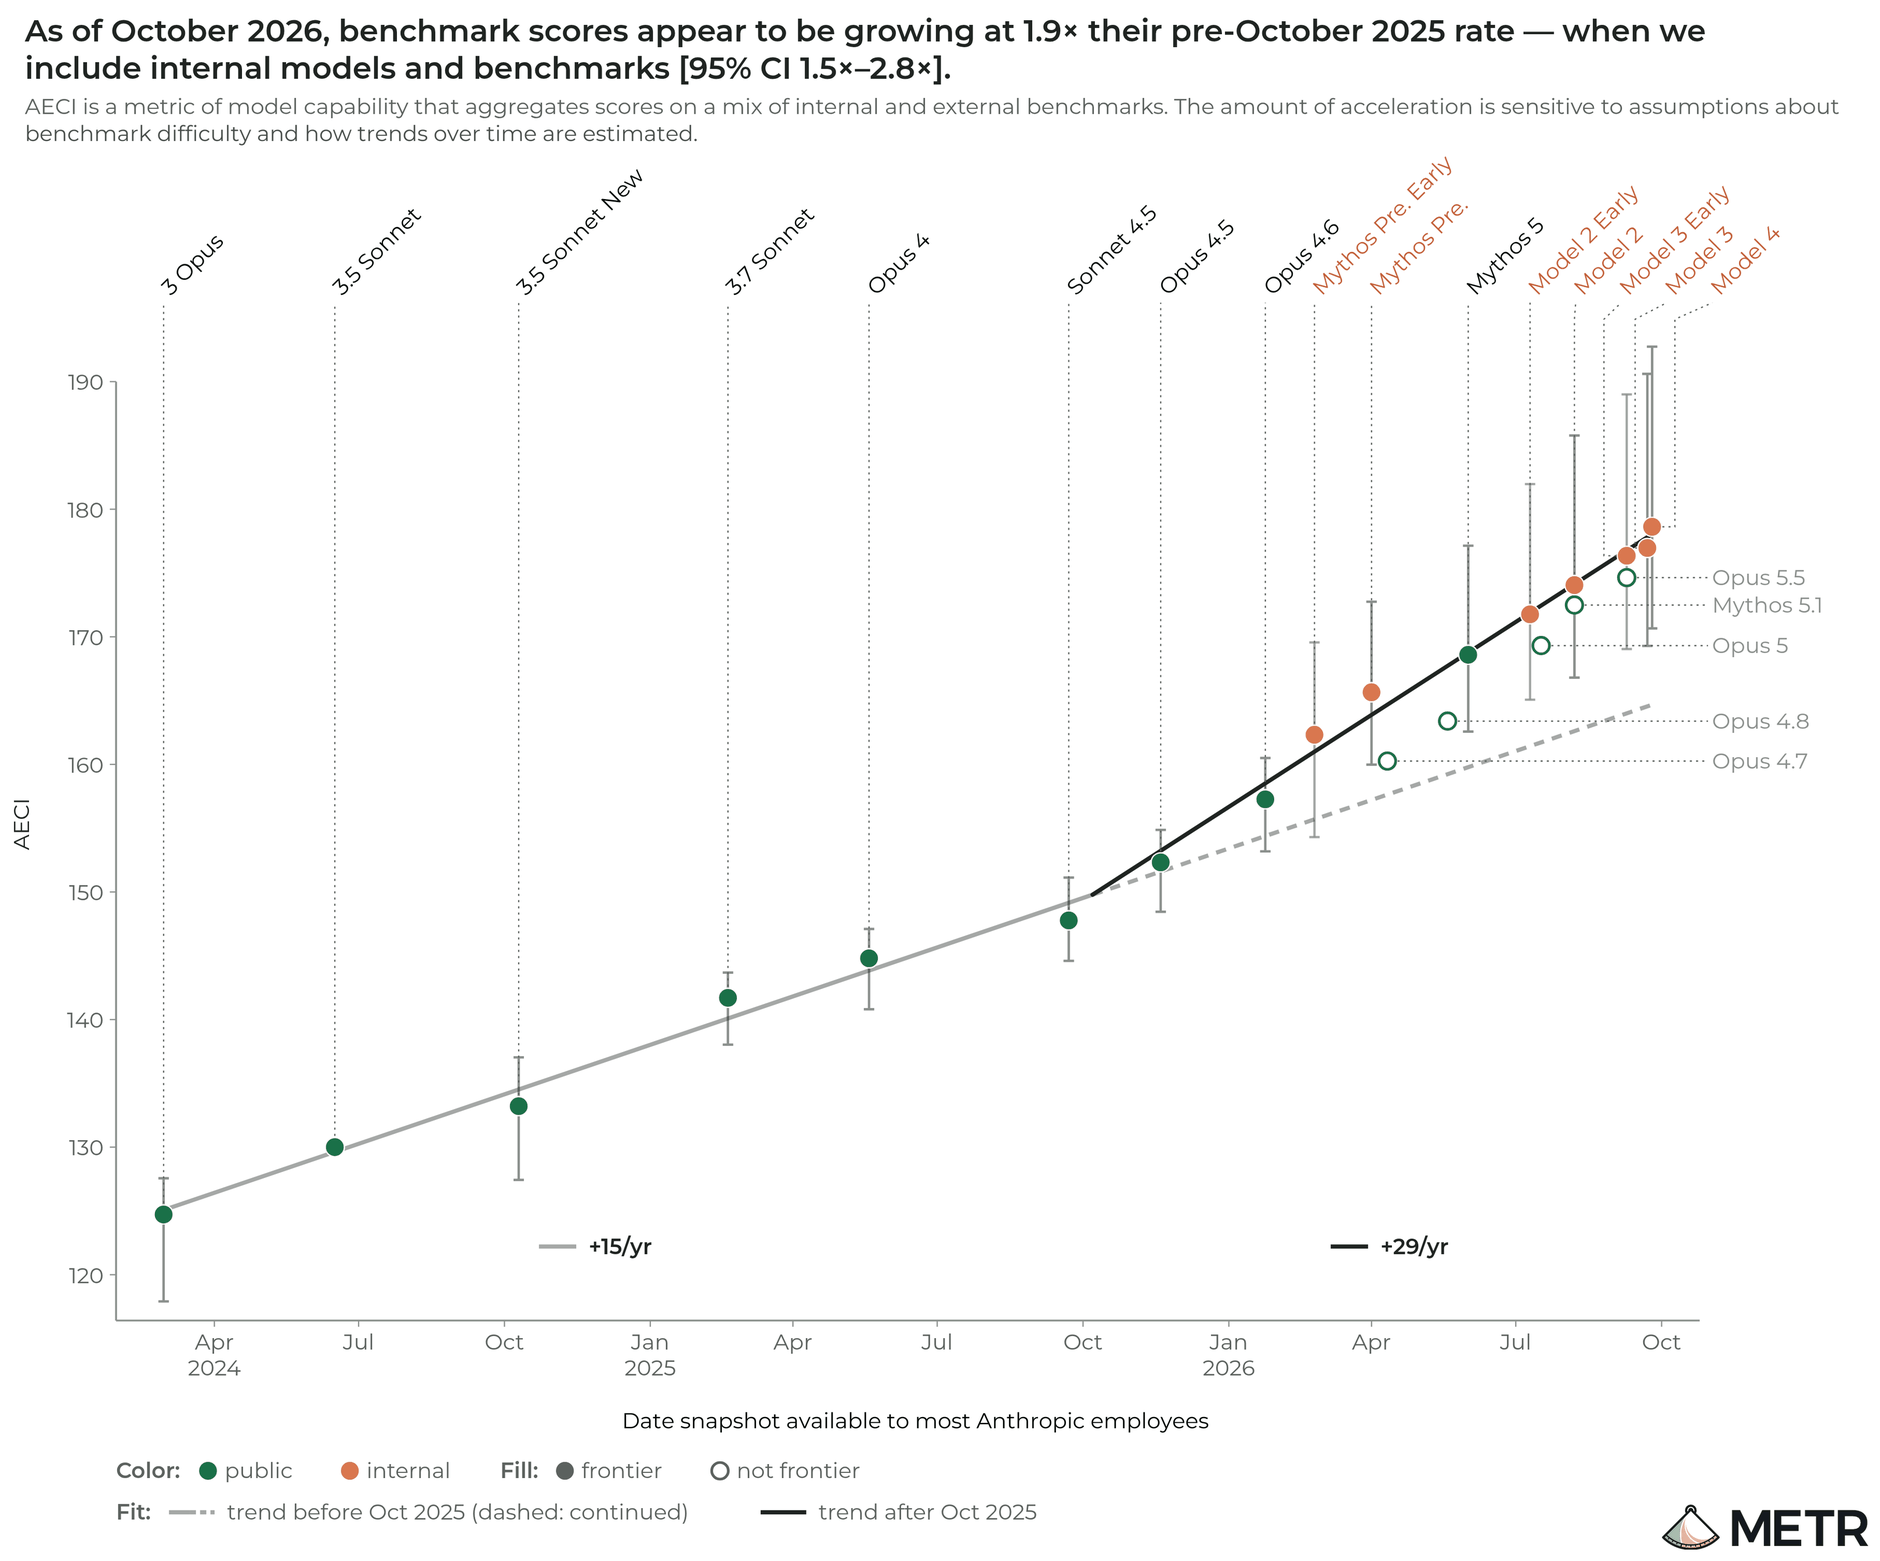
Figure 1: Source: METR, AI R&D Acceleration Assessment (2026-11-05).
Note that you are not talking about acceleration in practical effects: merely going faster than you previously would have expected if, for some reason, you believed that this “linear” rate should continue forever. This is unclear and METR buries their acknowledgement quite far down into the report writing: “We believe there is significant risk that acceleration in AECI may not map cleanly to acceleration in real-world impact.”1.
You might then, reasonably wonder: what is this AI index? And, perhaps, if you think a little further: why should I interpret this linearly and universally?
You should not interpret this linearly nor universally. There’s a couple things going on here:
- The AI index is a statement about log odds which are slightly counter-intuitive
- There’s unidentifiable assumption: there’s many plausible curves that could be fit and crucially we don’t have any data which would allow us to distinguish between them.
- Even thinking about this as a single dimension seems misleading: there seem to be at least two stories here (math vs non-math)
What METR has uncovered may simply be an artifact2 of the statistical model they have chosen: it is not necessarily a fact about the world.
Let’s dig in.
A brief Item Reponse Theory primer
The METR/Anthropic AI index (AECI), according to the documentation, is constructed in the same way as the Epoch ECI (just with proprietary eval sets). The Epoch AI Index, according to its documentation, is a 2-parameter Rasch Item Response model. Item Response Theory, in my opinion, is the least objectionable way to conduct evals/benchmarking so let’s unpack this further.
The general idea is that you have a bunch of items (indexed by \(i\) and a bunch of agents (indexed by \(j\)) to whom you poses the tasks and success/failure is measured by \(Y_{i,j}\) (0 if failure and 1 if success). A 2-paramter Rasch model just posits that \[ Y_{i,j} \sim logistic(a_{i}(\alpha_{j} - \delta_{i})) \]
where \(\alpha_{j}\) represents the ability of agent \(j\), \(\delta_{i}\) represents the difficulty of item i, and \(a_{i}\) represents the discrimination: how sharply the test distinguishes between ability levels.
This makes sense at the item level but they don’t want to work at the item level and instead the AI index data is aggregated at the benchmark level. This is a little inelegant, as we’ll see later, but we can still proceed. Thus what we observe is the fraction of tasks passed per benchmark (more-or-less3).
\[ \mu = E[\frac{1}{n} Y_{i,j}] = logistic(a_{i}(\alpha_{j} - \delta_{i})) \]
and then assuming a Beta distribution with standard deviation
\[ SD[\frac{1}{n} Y_{i,j}] = 2\sigma_{b}\sqrt{\mu(1-\mu)} \]
which gets a per-benchmark noise term \(\sigma_{b}\).
You can fit this sort of model using a nice Bayesian model which I won’t go into as it’s not relevant to this discussion. They do a couple other things that I’m not sure about about4 so for clarity I’ll just use their code to demonstrate everything below.
Can we replicate acceleration from the public data?
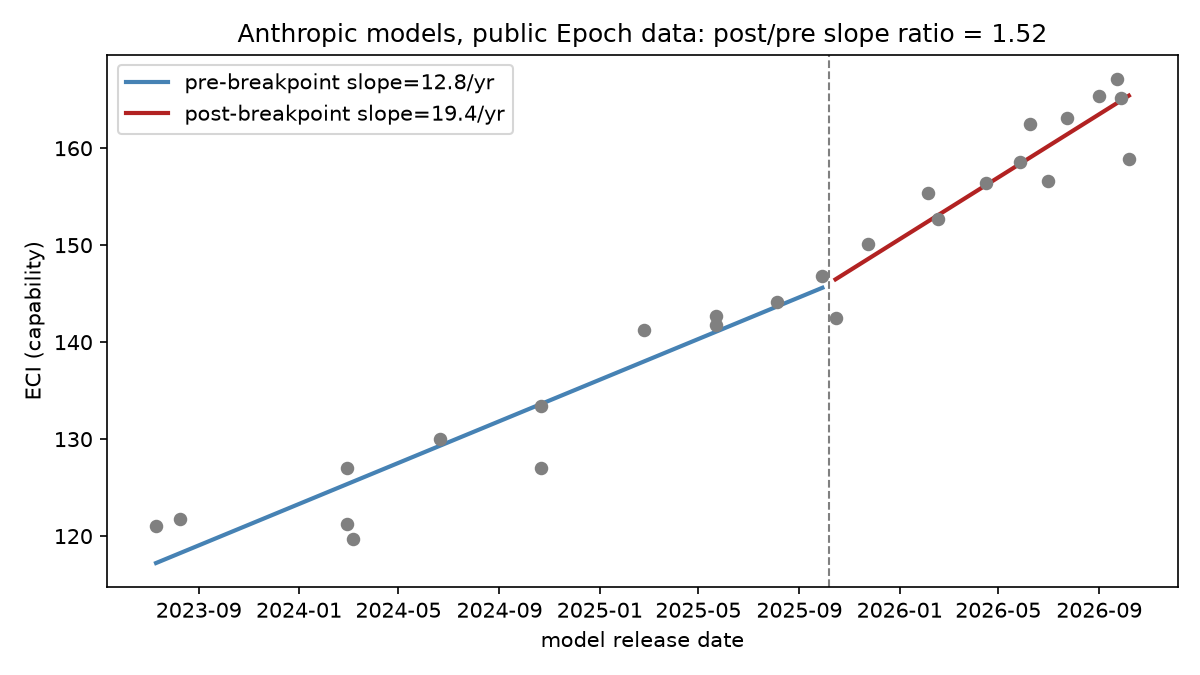
Indeed the first check is whether we can replicate their finding. We don’t have the proprietary data that METR based their analysis on but there is publically available benchmark results from Epoch. It won’t have the internal models nor the internal benchmarks but you could see a little slope increase in the public models on the private benchmark figure: we should should be able to see something.
full-panel fit: 254 models, 57 benchmarks

ALL benchmarks       n=26 (pre=13, post=13)  ratio=1.516

old-vintage benchmarks: 15, new-vintage benchmarks: 42

  (187 models, 15 benchmarks, all orgs)
OLD-vintage only     n=23 (pre=12, post=11)  ratio=0.670
  (192 models, 42 benchmarks, all orgs)
NEW-vintage only     n=25 (pre=12, post=13)  ratio=1.518
And indeed we due; using the same pre/post acceleration logic as the METR report (using their code) we get an estimate of 1.5x. So we’ll proceed assuming similar things hold in the proprietary data.
The Model Assumptions Strike Back
We’ve had to make quite strong assumptions with this model, namely:
- We have a linear relationship between scores: an increase of \(\Delta\) means roughly the same across all evals and for all models. So only the distance matters: not where you are on the particular difficulty curve. This by its nature precludes the potential for diminishing returns.
- We have a logistic relationship on the difference of scores: there’s really no reason to assume that this might be true or not. Indeed this additionally problematic because we’re not assessing on items but rather on benchmarks which are collections of items.
Let’s examine each in turn:
Saturation
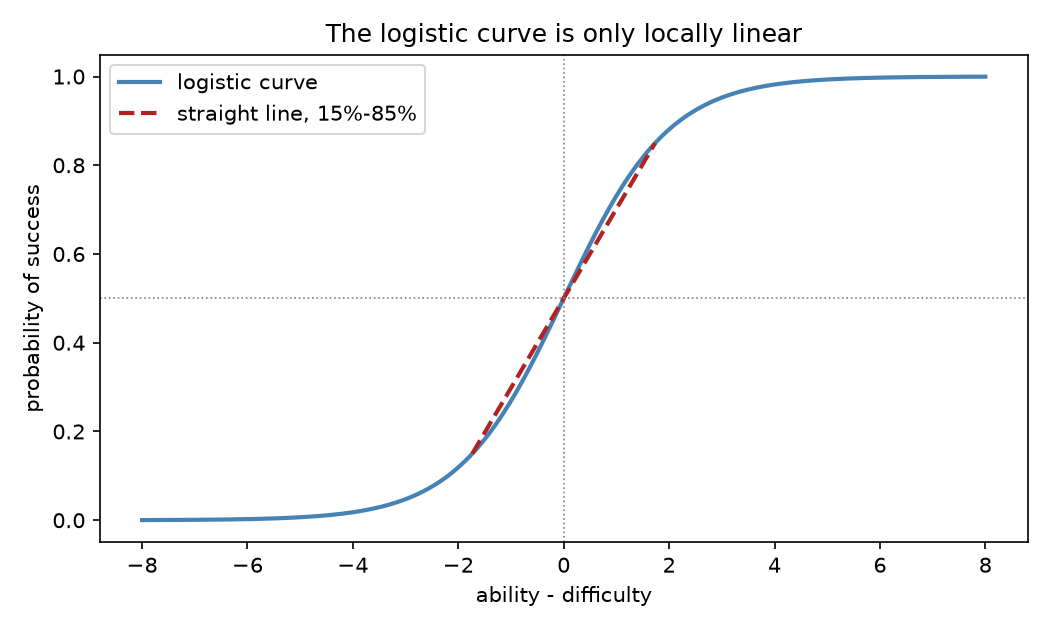
A linear score relationship implies strange things about the probability of success since we’re pushing this linear change through a logistic function. When scores (and consequently probability of success) are initially low there are large gains to linear increases. Indeed this gets faster and faster until at ~50% success probability it suddenly flips and now you’ve reached diminishing returns: each linear increase in ability yields a smaller increase in probability of success.
Now turning this around: for a constrant rate of probability of succes you see the opposite: it’s slow around 50% success and accelerates towards the tails. Suppose you are above 50% pass rates: you will see a decelleration in probability of success even while seeing acceleration of ability scores. As mentioned in the intro: the gain between 90% probability of success and 99% probability of success: that’s the exact same linear ability improvement as going from 99% to X.
And there’s reason to believe we are close to this case:
Anthropic’s internal benchmarks are increasingly saturated: Model 4 achieves greater than 50% on all the AECI benchmarks on which it was tested. However, measured acceleration appears reasonably robust to saturation concerns.
They measure saturation as >85% which is about where we start to see these effects really bite (in between 0.15 and 0.85 the logistic is reasonably approximated by a straight line as you can see in the earlier figure) Indeed when we look at the public data we see a similar trend occuring
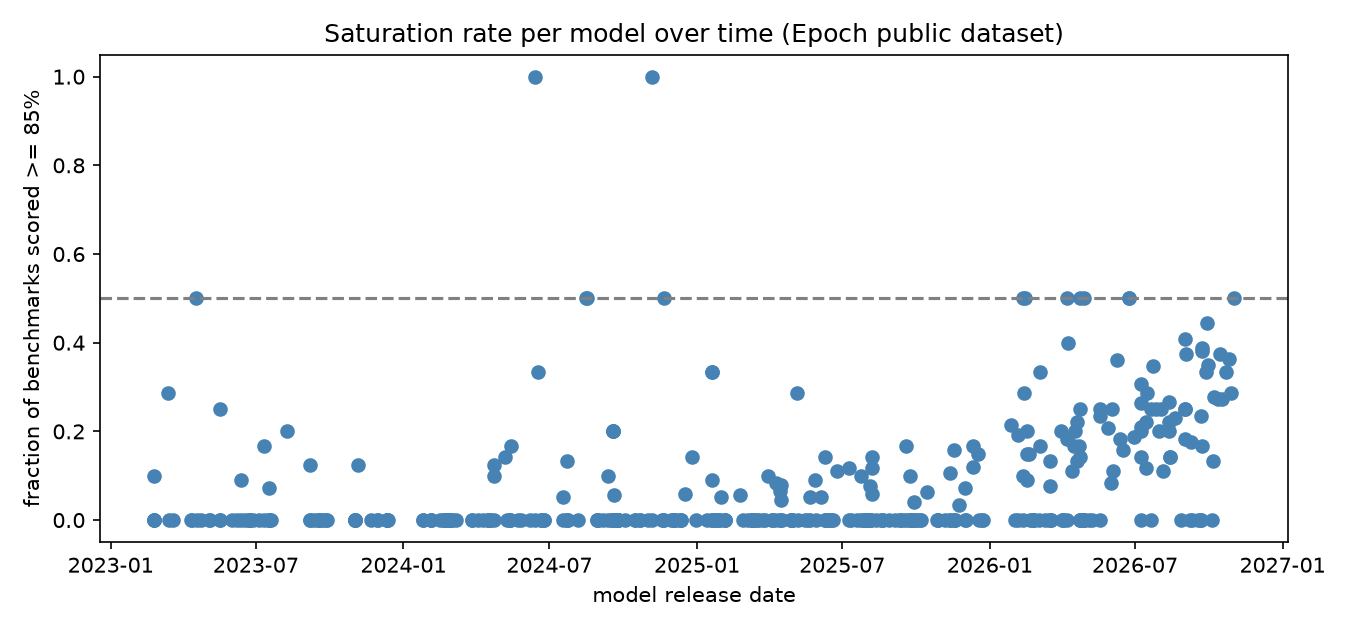
The METR report tries to patch up this by dropping benchmarks which are saturated. However this is not a sufficient fix: we don’t need a single benchmark to be saturated. We can get this if the mix of benchmarks shifts over time. If harder evals are being phased in then we’ll see this break in the ability-scale show up.
Now let’s see the mix shift effect: we’ll introduce progressively harder tests as we go onwards.
This matches what we see in practice. Benchmarks get retired once a frontier model can solve them and they get replaced by harder ones: thus ARC_AGI becomes ARC-AGI-2 and so-on).
This leads to the problem of drift.
Mix-shift alone is one half of the story. The other: every benchmark above is calibrated EXACTLY to the frontier at the instant it’s introduced – a designer with perfect, instant knowledge of current ability. Real benchmark design takes time, and more specifically, a lab’s INTERNAL frontier is ahead of what’s publicly known (nobody outside has even heard of the next model yet) – so a benchmark calibrated against the best PUBLICLY known model is calibrated against a stale reference by construction, not by designer error.
real (margin, discrimination) pairs from 44 benchmarks
margin (generation units): median=6.01
discrim (synthetic scale): median=0.0370

Fully real-calibrated: real quarterly cadence, margin/discrimination resampled
from the real estimated pairs above -- no assumed lag, no assumed spread. True
ability grows at the real historical constant rate throughout.

seed=0  ratio=1.029  frac_saturated=0.0076
seed=1  ratio=1.034  frac_saturated=0.0049
seed=2  ratio=1.052  frac_saturated=0.0037
seed=3  ratio=1.129  frac_saturated=0.0039
seed=4  ratio=1.064  frac_saturated=0.0012
So: can pushing this mechanism harder reach METR’s reported 1.9x [95% CI: 1.5, 2.8]? The obvious lever is to make post-breakpoint calibration worse than the data actually show.
extra_shift = additional generations subtracted from the REAL post-breakpoint
margin pool (already era-specific, median -0.2 gen before any shift) -- how much
WORSE than reality would calibration need to be to approach 1.9x?

extra_shift=  0  mean_ratio=1.019  range=[0.992, 1.065]
extra_shift= 10  mean_ratio=1.005  range=[0.959, 1.062]
extra_shift= 20  mean_ratio=0.995  range=[0.942, 1.048]
extra_shift= 40  mean_ratio=0.985  range=[0.926, 1.027]
Link Functions
But there’s another issue: it’s not clear that the logistic choice is correct:
There’s some weirdness here: these link functions make sense on a per-item basis. But, remember, the ECI is not measured on an item-level: it’s measured on a benchmark level. You basically get a score from the benchmark and assert that collectively it follows this distribution. This is problematic because we have very little reason to believe that benchmarks should exhibit this behavior in aggregate. Indeed you can get arbitrarily weird looking curves by changing up the distribution of difficulties.
For instance here’s a couple curves I generated just using different distributions of individually logistic items:
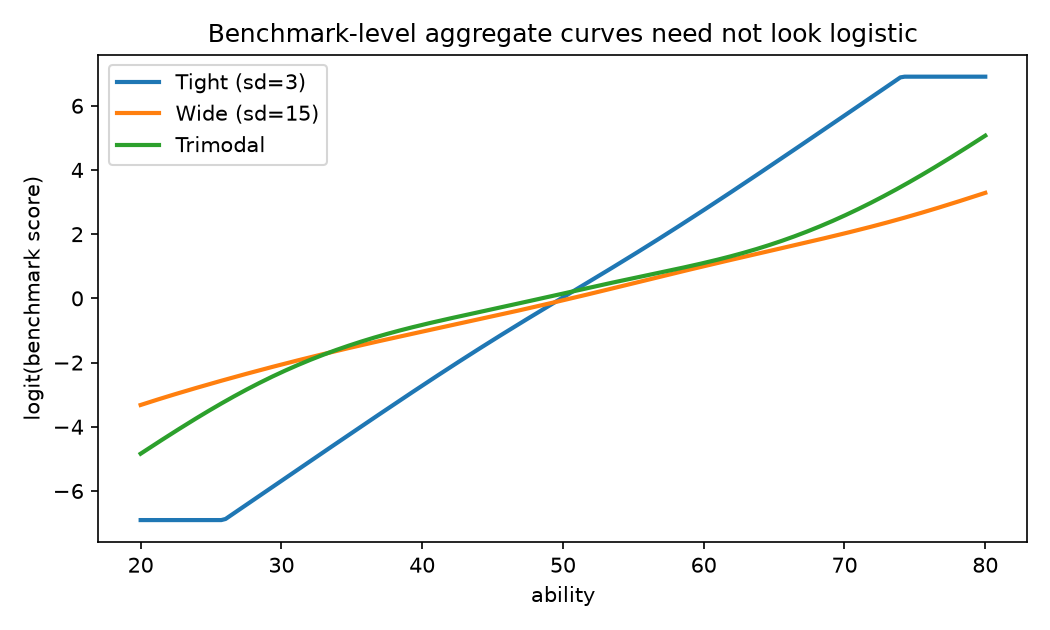
Every item here is exactly logistic; only the spread and shape of item difficulties within the benchmark differ. The tight distribution nearly reproduces a straight line in logit space (all items agree on where the benchmark “is”), the wide one flattens out, and the trimodal one visibly kinks at the ends: none of which you could tell apart without looking into the scores themselves.
Which, of course, they do and find that “Most of the benchmarks used for Model 4 appear reasonably linear in log-odds space.” These seem to indicate that the logistic link function works? Let’s check them out?
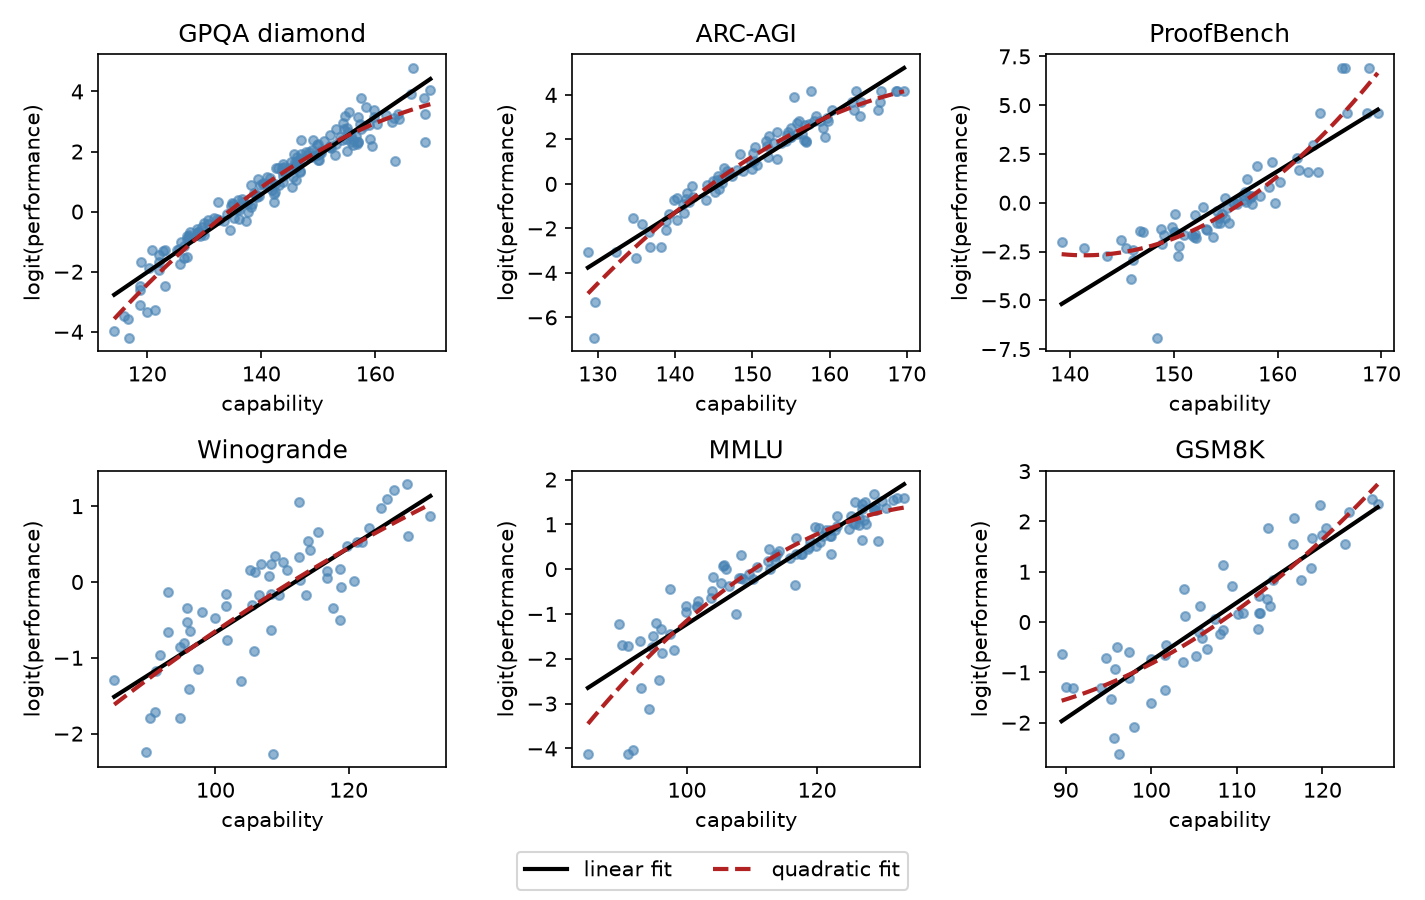
benchmarks tested: 56
significant curvature (p<0.05): 15 (26.8%)
            benchmark   n       quad_p
         GPQA diamond 174 1.309414e-14
              ARC-AGI  89 1.938476e-08
           ProofBench  70 2.654082e-07
        Chess Puzzles  85 1.028010e-05
                 MMLU  92 1.070647e-05
         FrontierCode  42 6.473409e-05
              Cybench  19 7.982069e-05
          APEX-Agents  55 1.219482e-03
          SimpleBench  78 2.488593e-03
Surface Evolver Bench  24 5.952378e-03
Like they do “sort of look linear” but when you run a statistical test on adding a quadratic term you find that 15/56 fail to validate the logistic curve. We don’t have access to the Anthropic sets: you can certainly design benchmarks to follow these and presumably there’s someone smart at Anthropic that could have done so. But hard to say.
This is a place where I’d admit that all models are wrong: what matters is how bad this affects our decision. Noteably they acknowledge that the link function matters and their estimates for acceleration range from 1.1 to 2.9x depending on the link function. Which does leads to some significant uncertainty but also! remember that there are infinite potential link functions. We can only distinguish between link functions in the regions where we have data. We are particularly blind in the sparse regions where we have little data. Thus we would be more concerned if these violations from our fits tended to be in the high capability range (and especially if they tend to be overestimates of performance).
Thus how much does the curvature affect our estimates for the highest-capability models?
significantly-curved-benchmark rows: 1087
high-capability subset (capability >= 156.1): n = 267

median |residual|, logit space: 0.133
effective ability offset (local slope): median 1.06 , 90th pct 6.18 , max 34.28
effective ability offset (global/average slope): median 0.93 , max 6.47
local/global ratio: median 1.15 x, 90th pct 2.33 x, max 5.3 x

|offset| > 2 ECI points: 70 / 267 (26.2%)
|offset| > 5 ECI points: 35 / 267 (13.1%)
|offset| > 10 ECI points: 17 / 267 (6.4%)
|offset| > 20 ECI points: 6 / 267 (2.2%)

benchmarks contributing offsets > 5 points: ['APEX-Agents', 'ARC-AGI', 'Chess Puzzles', 'GPQA diamond', 'SimpleBench']
For reference, the whole Claude 3.5 Sonnet -> GPT-5 anchor span is 20 ECI points. Thus we see there is a particularly heavy tail
Does a single dimension even make sense?
We’ve been laborouring under this assumption that there is indeed a single “ability score”. This should remind folks of IQ and the infamous g-factor. Like if we applied this reasoning to humans we would catch that this doesn’t make sense: just because someone performs well on a math test does not imply that they would perform well on a medical knowledge test: indeed it might even be the opposite. That said, there still is some latent factor in there that explains both. The question then becomes how explanatory this factor is and crurically what if there’s actually a couple?
So let’s take a look at a dimensionality analysis of these benchmarks
This hits particuarly hard when we consider that reinforcement learning from verifiable rewards (RLVR) is in play: like we totally expect math to benefit from this while medicine will not.
To check let’s look at our model residuals: if there’s a single-factor then those residuals should be iid noise. If however, those residuals still contain structure we know there’s something else going on. The approach: fit the same single-factor (2PL) model used throughout this post, take the logit-space residual of every (model, benchmark) observation from that single-factor fit, and ask whether those residuals still contain structure.
fraction of the model x benchmark grid actually observed: 0.192

component  observed  null_mean  null_p95  p_value
1          17.56     14.30      14.88     0.0
2          14.34     13.54      13.93     0.002
3          12.95     12.73      13.17     0.228
4          12.52     11.94      12.38     0.018
5          11.82     11.34      11.75     0.026
6          11.35     10.81      11.17     0.008
7          10.94     10.40      10.67     0.002
8          10.66     10.10      10.33     0.0
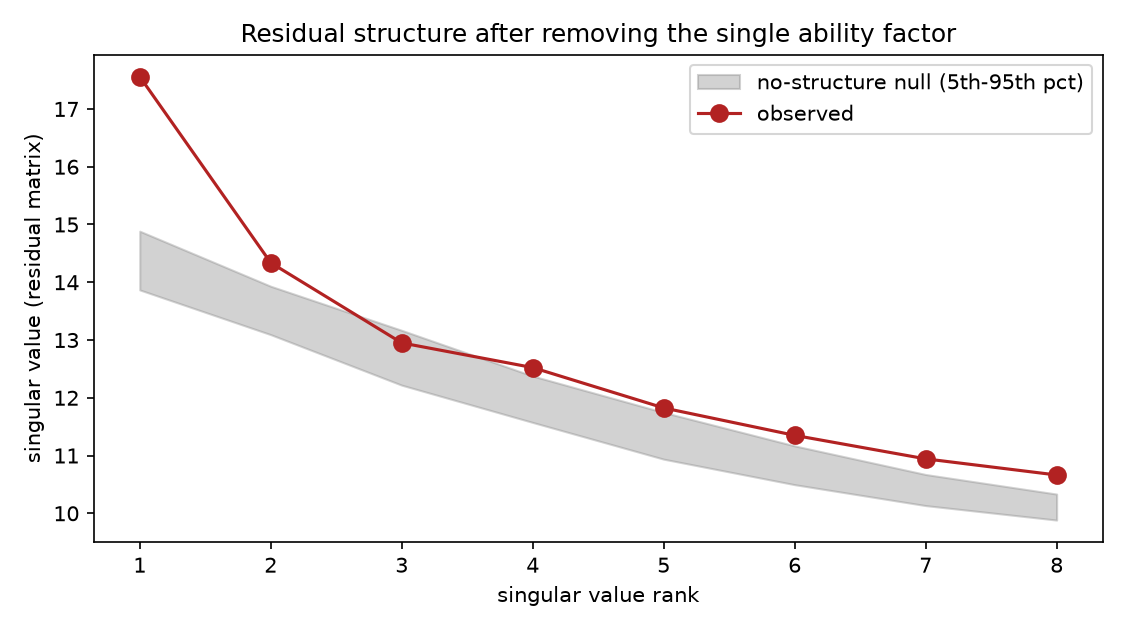
The top residual component sits well above anything the null distribution: there’s a real factor left over after the general ability factor. So what is it?
most negative loadings on residual factor 1:
  OTIS Mock AIME 2024-2025            -0.387
  FrontierMath-Tiers-1-3-v2-Private   -0.292
  FrontierMath-Tier-4-v2-Private      -0.182
  MATH level 5                        -0.168
  Furniture Assembly                  -0.118
  ProofBench                          -0.112
  WeirdML                             -0.076
  VPCT                                -0.043
  EBR-bench                           -0.025
  GeoBench                            -0.024
most positive loadings on residual factor 1:
  APEX-Agents                         0.086
  Aider polyglot                      0.087
  SimpleBench                         0.143
  ARC-AGI-2                           0.177
  Mystery Game Puzzles                0.182
  GPQA diamond                        0.203
  SimpleQA Verified                   0.244
  ARC-AGI                             0.244
  LMCA                                0.407
  DTBench                             0.472
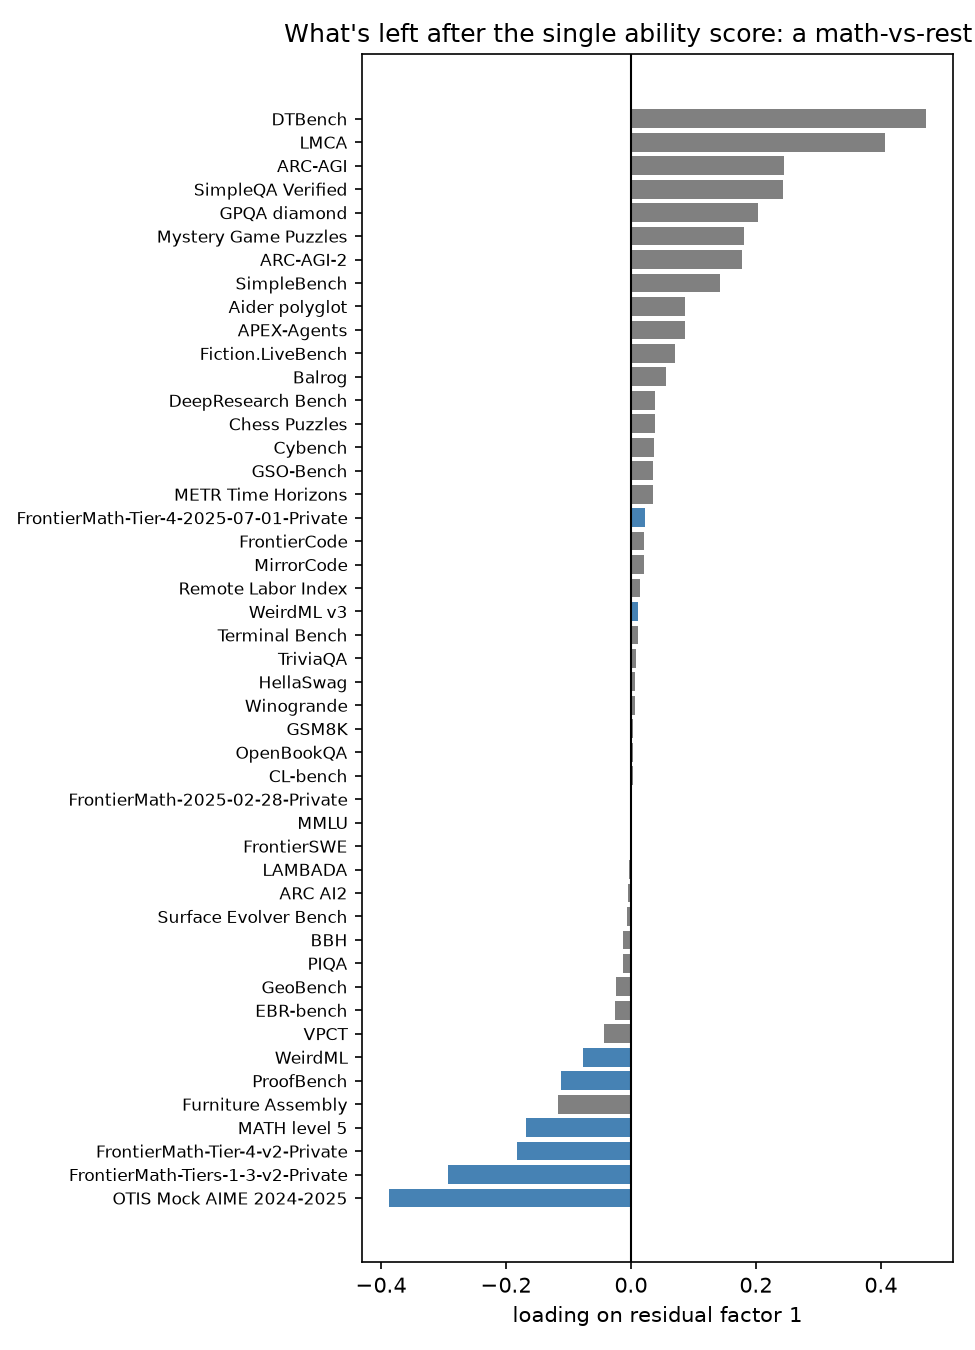
It looks like it’s everything other than math! The negative loading benchmarks are almost all math related and the positive loading benchmarks are all general knowedge / reasoning / coding related.
Note that the sign is interesting here: these are negative loadings. If something were to cause agents to become better at math (cough RLVR) then that would show up in the original loading: these additional structure is just needed to capture the residuals better.
math-loading (< -0.05): 7 benchmarks
rest-loading (> +0.05): 12 benchmarks

  (163 models, 7 benchmarks)
MATH-loading n=25 (pre=12, post=13)  ratio=1.341
  (188 models, 12 benchmarks)
REST-loading n=25 (pre=12, post=13)  ratio=1.128
Where does this leave us?
So we’ve replicated a version of METR’s acceleration claim. Do we believe it?
At the very least we can conclude that Anthropic’s latest models are likely5 better than their earlier models.
Aside from that it’s unclear how one would measure acceleration. As we’ve seen acceleration on ability scores presumes an interval scale for capability and no such scale is inherently implied by bechmark pass-rates. This simply isn’t something you can measure: it’s not that we need more data, any data of this sort just cannot answer this question.
Regardless I think you can find issue with model based scores altogether: they lack interpretability. What would be more interesting is something like comparing to a fixed distribution of ailitities: say get a bunch of humans and measure their ability and then compare against that. This will be tell us whether the gain is moving through a range of relevant task-performance or whether we’re just mesauring artifacts.
There’s reasons to suspect that there are mechanisms which suggest discounting these estimates: quite hard to say.
The most damning analysis is this assumption of uniformity. Like it’s quite clear that math and other verifiable fields are being targetted. METR somewhat nods to this with their “well-specified tasks” language but even then they’re conflating between these math benchmarks and general knowledge benchmarks.
But also, there seems like there’s something there.
Perhaps it’s clear from the redacted material
Personally I’m Like I certainly used Claude when I was writing up this analysis. It probably help me write it more quickly than I would otherwise. Is that generalizable: not really but it does seem to mesh with the researchers interviewed. Certainly anecdata and you have to discount due to the koolaid factor but it does seem that folks generally believe that using agentic coding is accelerating their work6. I find it fascinating that they don’t believe that additional resources isn’t a large factor: like it’s quite plausible that they’re research insight constrained but surely the rest helped more than 1.7x? Because I think that’s what this has to be saying; it seems insane that Claude is providing any significant lift on ideas more like reducing the burden of coding up experiments and prototypes. But even supposing that Claude brought this to zero that implied that researchers were spending $X of their bandwidth on that sort of thing? And it makes such a big deal: like everyone has been emphasizing the bitter lesson and scaling laws and it’s wild that this isn’t considered more seriously. This seems more consistent with the intrepreation that in the last year RLVR started becoming a big deal and METR’s benchmarks are driven by areas that are amenable to this. That’s a much weaker claim than recursive self-improvement as improving LLMs in generality does not seem to allow easy verification. But does speak to the power of new approaches [even if they don’t see benefits across the board]
-
Of course they also hedge the other way:" If real-world impact is a convex function of benchmark scores, e.g. if impact depends on crossing a capability threshold, then AECI would understate real-world acceleration. In some domains we have seen a steady increase in benchmark scores accompanied by sudden accelerations in real-world impacts, e.g. impacts on the rate of discoveries in cybersecurity or math" ↩︎
-
Indeed they mention as such but then proceed to ignore these caveats
↩︎The 1.9x acceleration [95% confidence interval: 1.5–2.8x] in the AECI trend since October 2025 described below significantly informed this view, but could be explained by overfitting to the benchmark distribution or otherwise be an artifact of the AECI methodology.
-
They recognize that there are likely broken tasks and some ability to randomly guess and they adjust the results accordingly: basically scaling [random_chance, 1 - wrong_fraction] to [0,1]. They then model the mean of these aggregates similarly to the Rasch model ↩︎
-
I replicated what I thought was the model but got different results ↩︎
-
Aside from questions like “what if they’re overfitting to the benchmark” or (taking overfitting to an extreme) “the AI just stole the answers”, c.f. the OpenAI rogue agent breach of Hugging Face ↩︎
-
Keep in mind METR’s previous report showing that folks who believed AI was saving time were actually slower. ↩︎