The AI measurement organization METR released a report claiming that AI development has accelerated stating:
As of October 2026, Anthropic is likely improving the capabilities of their models on well-specified tasks at around twice the rate they did between March 2024 and October 2025. This estimate is given with high uncertainty; we would not be surprised if the true acceleration was closer to 1.3x or 3x the historical rate.
This is clearly relevant to the discussion of recursive self-improvement: the idea that you can use AI to make your AI better faster. And more broadly relevant to the discussion of AI speed-ups for software engineering in general. And, of course, specifically relevant to the imminent Anthropic IPO. So it’s worthwhile to understand exactly what’s being said here.
When you look into the report you find this 1.9x number is coming from improvements on their AI index. They have this figure which linearly extrapolates measurements of their AI index over time and find that there’s a step change over the previous rate of improvement.
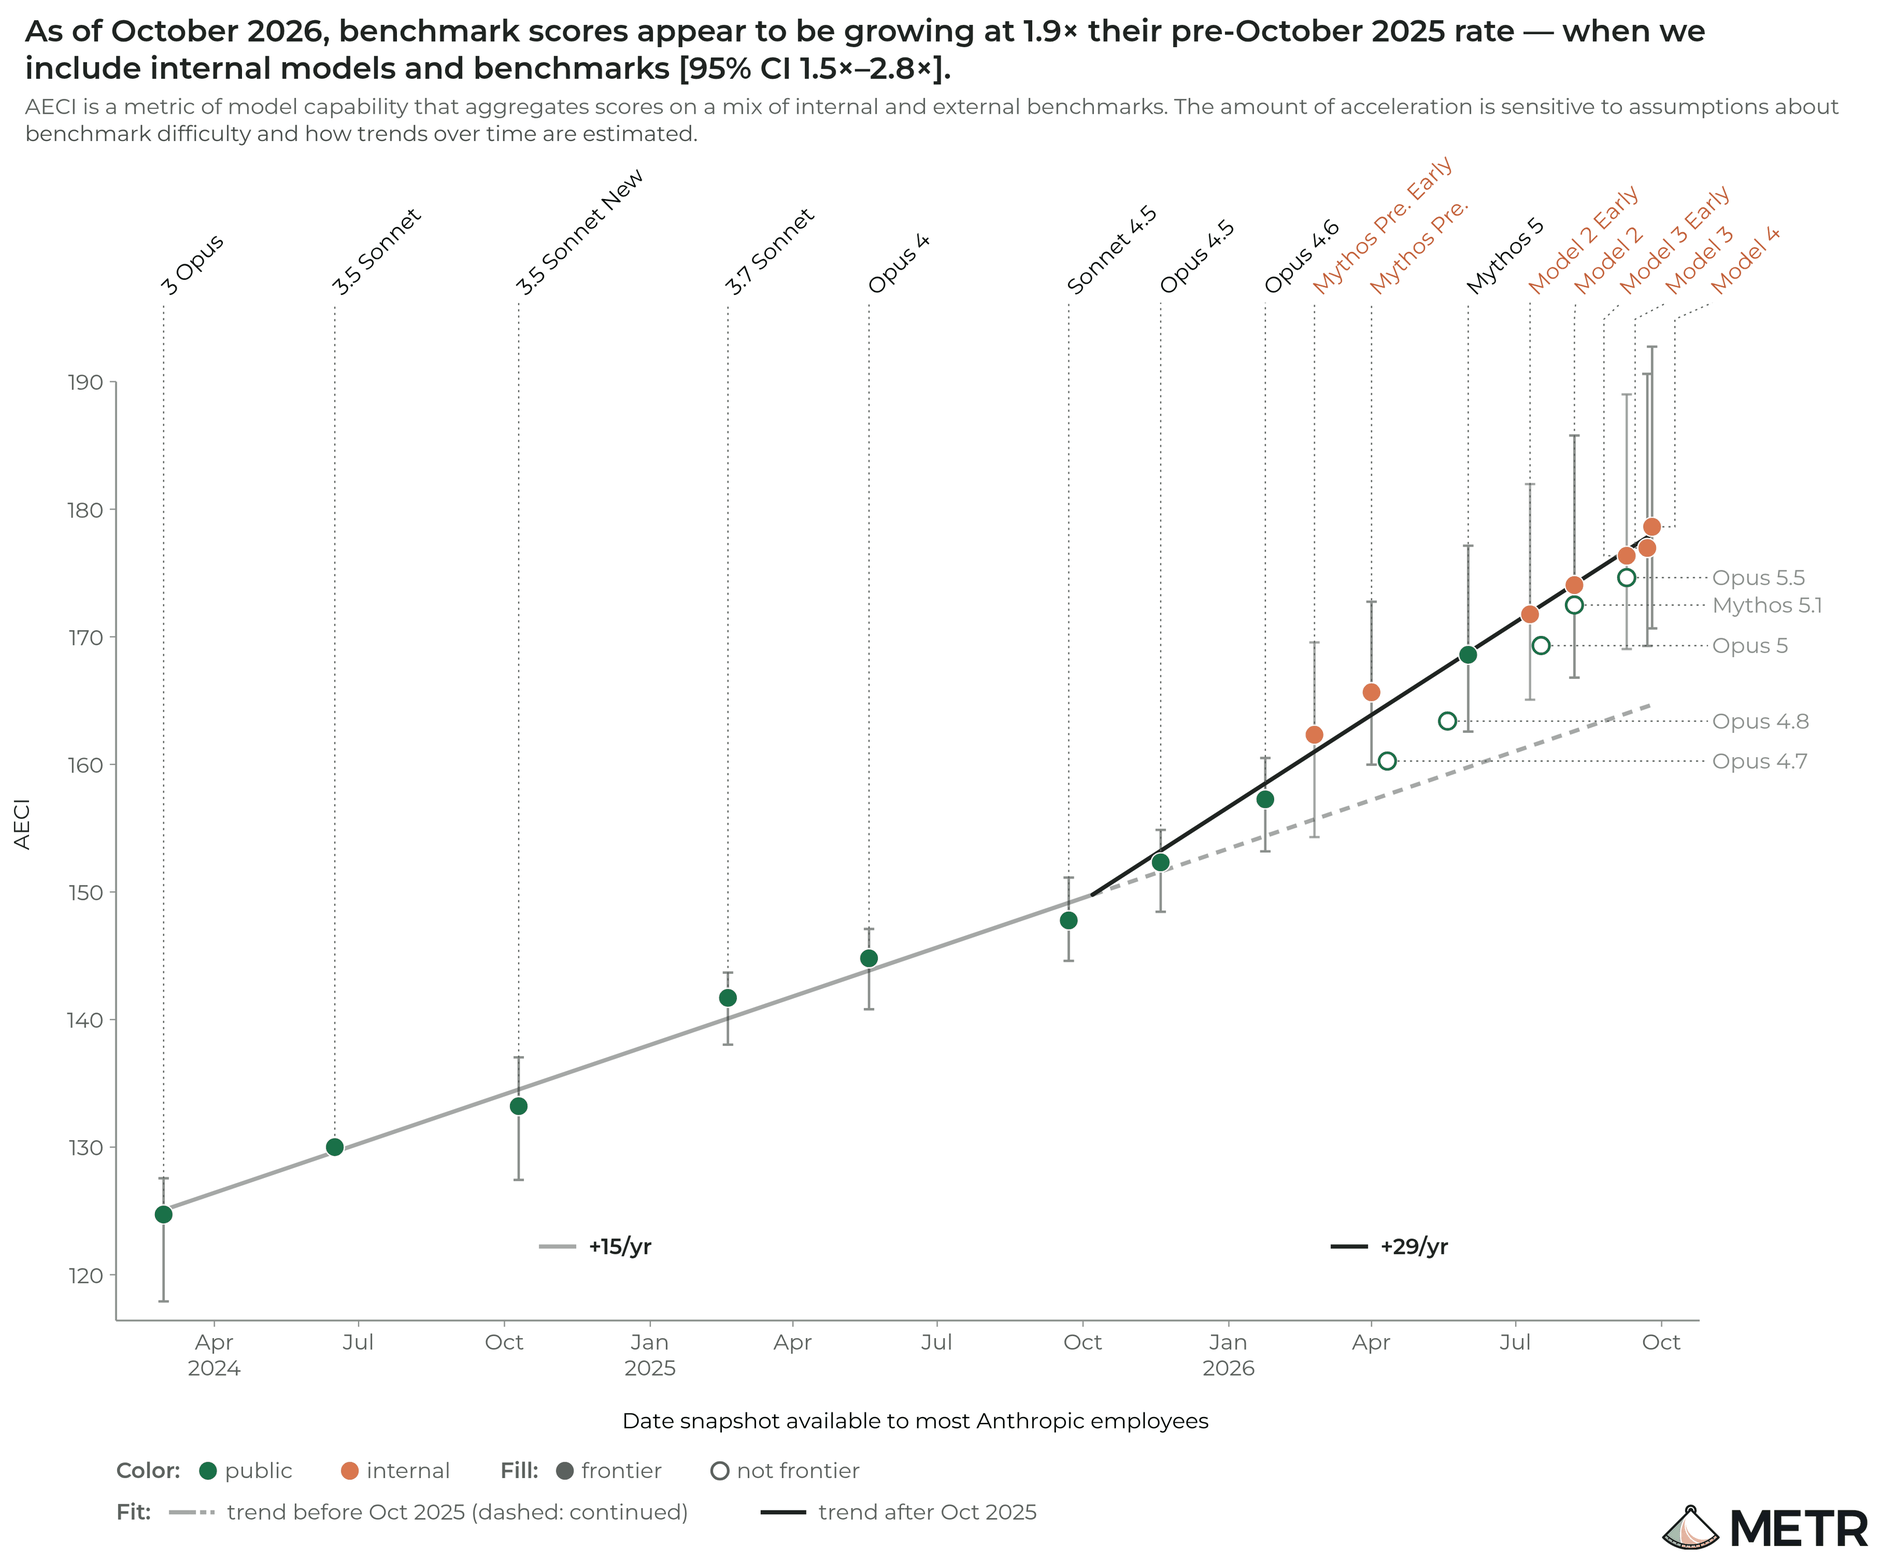
Figure 1: Source: METR, AI R&D Acceleration Assessment (2026-11-05).
Note that they are not talking about acceleration in practical effects1.. They are merely measuring going faster, on this scale, than you previously would have expected if, for some reason, you believed that this “linear” rate should continue forever.
You might then, reasonably wonder: what is this AI index? And, perhaps, if you think a little further: why should I interpret this linearly and universally?
Indeed, you should not interpret this linearly nor universally. There’s a couple things going on here:
- The AI index is a statement about log odds which are slightly counter-intuitive to what we typically think about progress
- There’s unidentifiable assumption: there’s many plausible curves that could be fit between AI capability and task success and crucially we don’t have much/any data which would allow us to distinguish between them.
- Even thinking about this as a single dimension seems misleading: there seem to be at least two stories here (math vs non-math) which are elided in this scalar representation.
What METR has uncovered may simply be an artifact2 of the statistical model they have chosen: it is not necessarily a fact about the world.
Let’s dig in.
A brief Item Reponse Theory primer
The METR/Anthropic AI index (AECI), according to the documentation, is constructed in the same way as the Epoch ECI (just with proprietary eval sets). The Epoch AI Index, according to its documentation, is a 2-parameter Rasch Item Response model. Item Response Theory, in my opinion, is the least objectionable way to conduct evals/benchmarking, but is rarely taught, so a crash course will be helpful for most.
The general idea is that you have a bunch of items (indexed by \(i\)) and a bunch of agents (indexed by \(j\)). You pose tasks to agents and the outcome is measured by \(Y_{i,j}\) (0 if failure and 1 if success). A 2-parameter Rasch model just posits that \[ P(Y_{i,j}=1) = \sigma(a_{i}(\alpha_{j} - \delta_{i})) \]
where \(\alpha_{j}\) represents the ability of agent \(j\), \(\delta_{i}\) represents the difficulty of item i, and \(a_{i}\) represents the discrimination: how sharply the test distinguishes between ability levels. \(\sigma\) is of course the logistic function mapping these log-odds to probabilities.
This makes sense at the item level but they don’t want to work at the item level and instead the AI index data is aggregated at the benchmark level. This is a little inelegant, as we’ll see later, but we can still proceed. Thus what we observe is the fraction of tasks passed per benchmark (more-or-less3). They then model the mean of these aggregates similarly to the Rasch model.
\[ \mu = \sigma(a_{i}(\alpha_{j} - \delta_{i})) \]
and then assuming a Beta distribution with standard deviation \(2\sigma_{b}\sqrt{\mu(1-\mu)}\) which gets a per-benchmark noise term \(\sigma_{b}\).
You can fit this sort of model using a nice Bayesian model which I won’t go into as it’s not relevant to this discussion. They do a couple other things that I’m not sure about4 so for clarity I’ll just use their code to demonstrate everything below.
Can we replicate acceleration from the public data?
The first check is whether we can replicate their finding. We don’t have the proprietary data that METR based their analysis on but there are publicly available benchmark results from Epoch which should form a subset. It won’t have the internal models nor the internal benchmarks but you could see a little slope increase in the public models on the private benchmark figure in METR’s report: we should be able to see something.
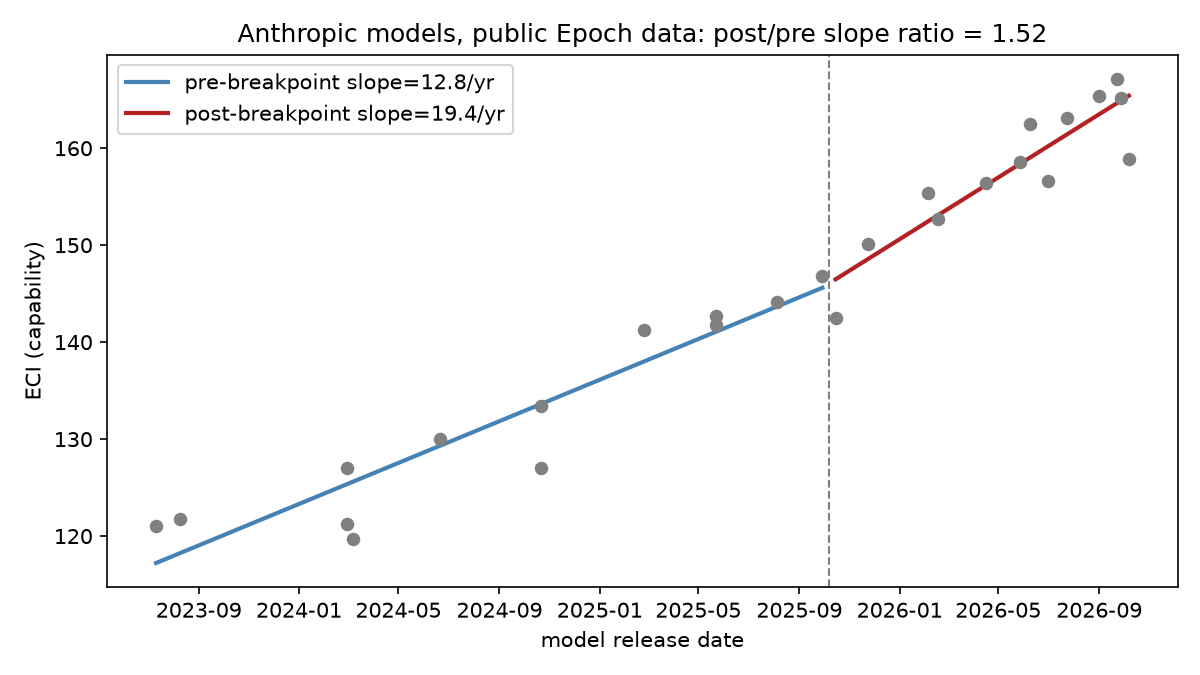
Figure 2: Replicated figure using only public Epoch data with same methodology.
And indeed we do; using the same pre/post acceleration logic as the METR report (using their code) we get an estimate of 1.5x. So we’ll proceed assuming we’re not too off-base assuming that similar dynamics hold in the proprietary data.
The Model Assumptions Strike Back
We’ve had to make quite strong assumptions with this model, namely:
- We have a linear relationship between scores: an increase of \(\Delta\) means roughly the same across all evals and for all models. Only the distance matters: not where you are on the particular difficulty curve. This by its nature precludes the potential for diminishing returns.
- We have a logistic relationship on the difference of scores: there’s really no reason to assume that this might be true or not. This is not concerning in the middle of the ability curves which are mostly linear but makes a great deal of difference in the tails. This is additionally problematic because we’re not assessing on items but rather on benchmarks which are collections of items which lead to these assumptions being even more fragile.
Let’s examine each in turn:
Linearity and Saturation
A linear score relationship implies strange things about the probability of success since we’re pushing this linear change through a logistic function. When scores (and consequently probability of success) are initially low there are large gains to linear increases. Indeed this gets faster and faster until at 50% success probability it suddenly flips and now you’ve reached diminishing returns: each linear increase in ability yields a smaller increase in probability of success. To make this concrete the gain between 90% probability of success and 95% probability of success: that’s the exact same linear ability improvement as going from 95% to X.
But for the bulk of the distribution we’re actually ok with this linearity as you can see in the figure below. It’s only in the tails where this becomes sharply non-linear.
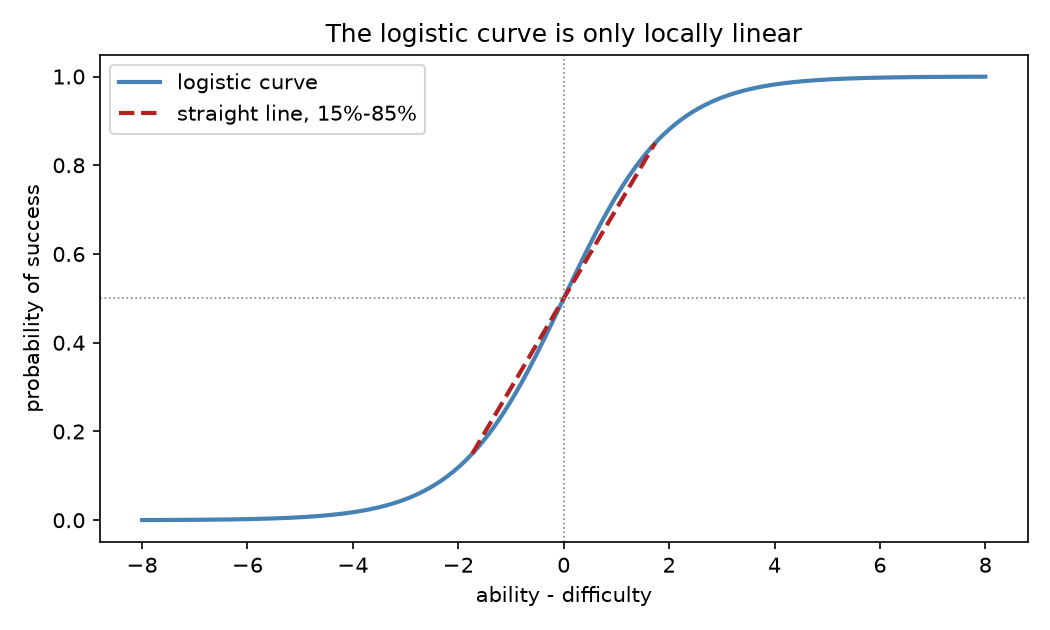
So this only matters if we’re mostly in the tails. Otherwise our intuitions about progress and ability make sense: the linearity of the approximation and probabilities are matched. But there’s reason to believe we are close to this case, as METR writes
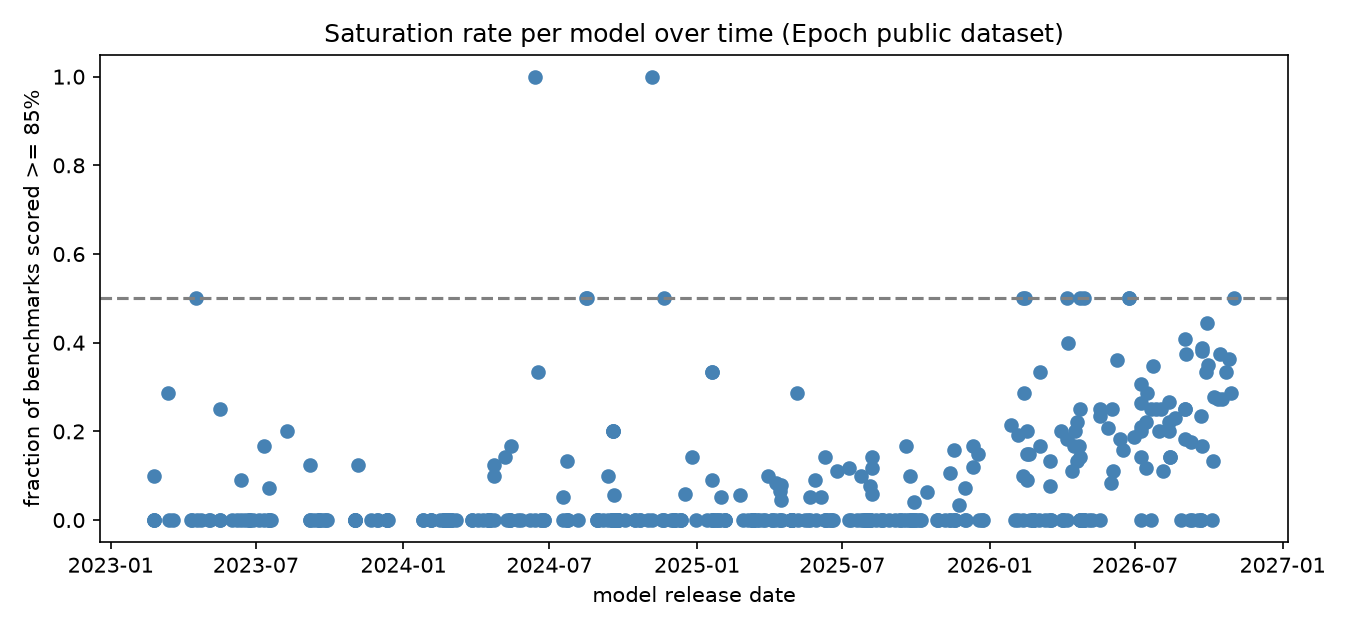
Anthropic’s internal benchmarks are increasingly saturated: Model 4 achieves greater than 50% on all the AECI benchmarks on which it was tested. However, measured acceleration appears reasonably robust to saturation concerns.
They measure saturation as >85% which is about where we start to see these effects really bite (as above). Indeed when we look at the public data we see a similar trend occurring
Link Functions
But there’s another issue: remember that choice of the logistic function. How can we be sure that is correct?
There’s some weirdness here: these link functions make sense on a per-item basis. But, remember, the ECI is not measured on an item-level: it’s measured on a benchmark level. You basically get a score from the benchmark and assert that collectively it follows this distribution. This is problematic because we have very little reason to believe that benchmarks should exhibit this behavior in aggregate. Indeed you can get arbitrarily weird looking curves by changing up the distribution of difficulties.
For instance here’s a couple curves I generated just using different distributions of individually logistic items: only the spread and shape of item difficulties within the benchmark differ.
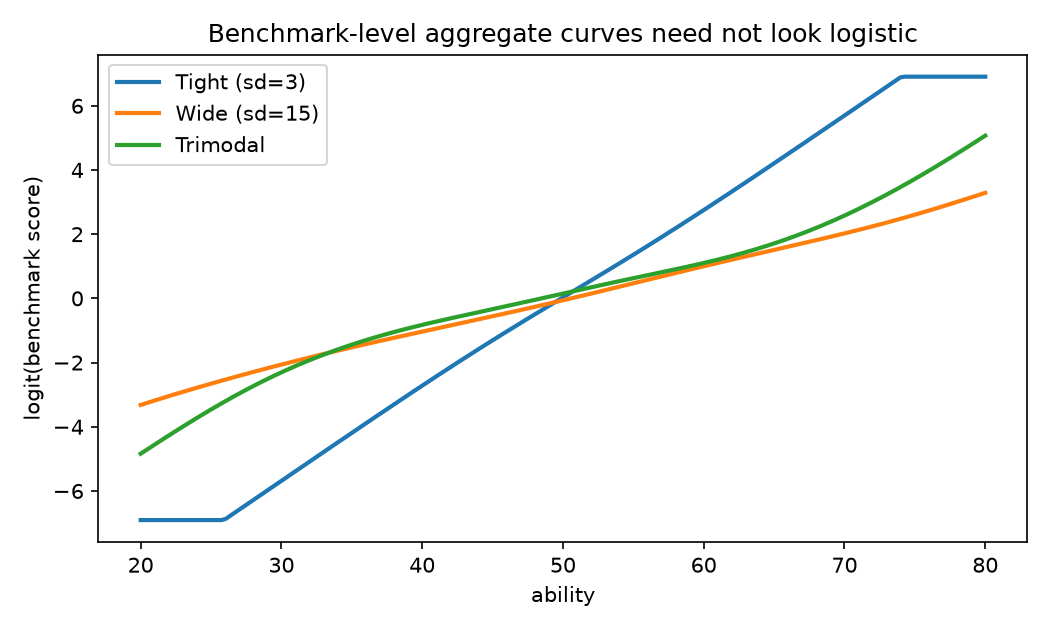
The tight distribution nearly reproduces a straight line in logit space (all items agree on where the benchmark “is”), the wide one flattens out, and the trimodal one visibly kinks at the ends: none of which you could tell apart without looking into the scores themselves.
So, of course, METR looks and finds that “Most of the benchmarks used for Model 4 appear reasonably linear in log-odds space.” These seem to indicate that the logistic link function works? Let’s do a similar check on the public data:
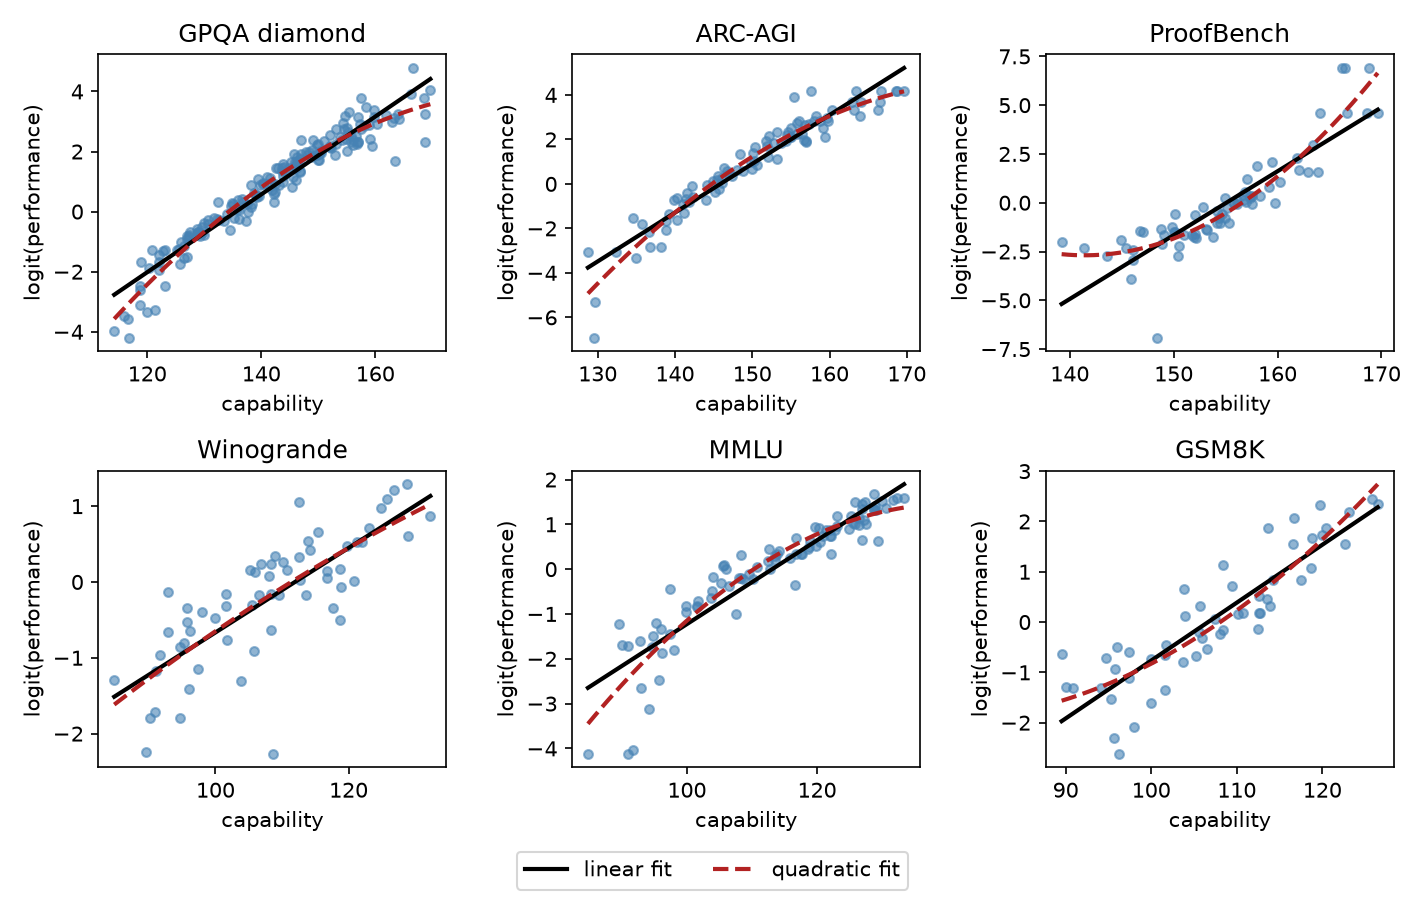
Like they do “sort of look linear” but when you run a statistical test we find that 15/56 fail to validate the logistic curve. We don’t have access to the Anthropic sets: you can certainly design benchmarks to follow these and presumably there’s someone smart at Anthropic that could have done so. But hard to say.
This is a place where I’d admit that all models are wrong: what matters is how badly this affects our conclusions. Notably they acknowledge that the link function matters and their estimates for acceleration range from 1.1 to 2.9x depending on the link function. Which does lead to some significant uncertainty but also remember that there are infinite potential link functions. We can only distinguish between link functions in the regions where we have data.
We are particularly blind in the sparse regions where we have little data. Thus we would be more concerned if these violations from our fits tended to be in the high capability range (and especially if they tend to be overestimates of performance).
Thus how much does the curvature affect our estimates for the highest-capability models? Let’s plot the “effective ability offset” basically how much we have to change the model scores to fit the residual
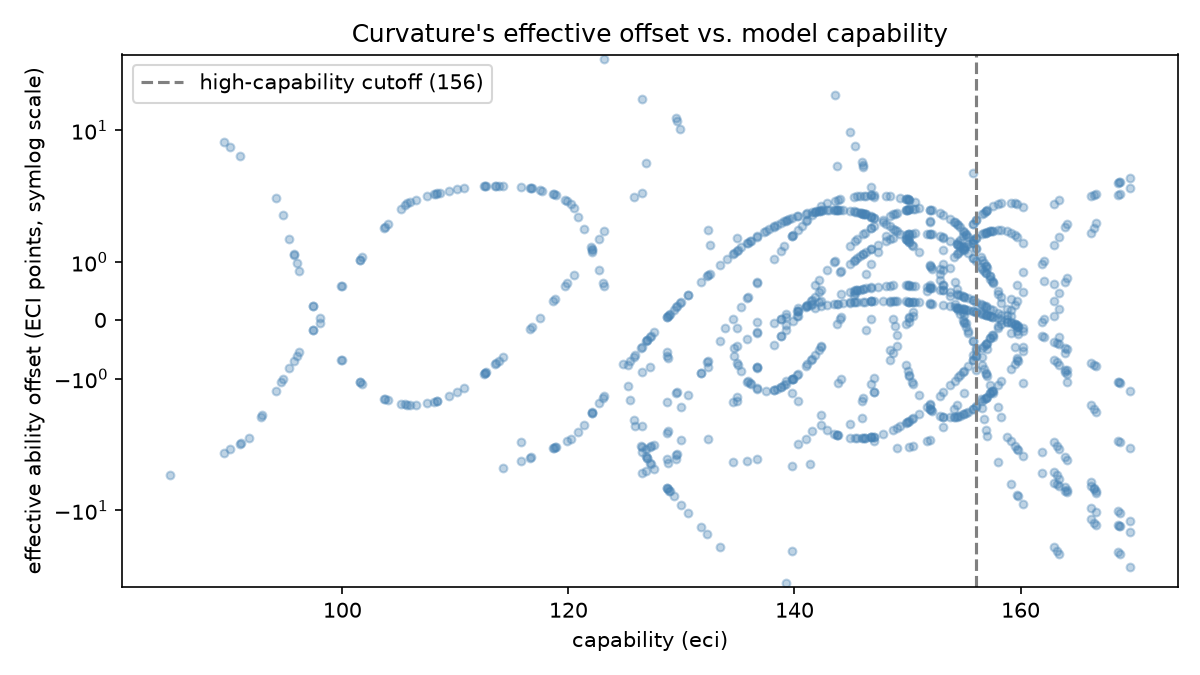
For reference, the whole Claude 3.5 Sonnet -> GPT-5 anchor span is 20 ECI points. Thus we see there is a particularly heavy tail towards the higher values with a good number of relatively large negative offsets required. Not certain but certainly suggestive that perhaps we’re not fitting well and are overstating effects.
Does a single dimension even make sense?
Thus far we’ve been laboring under this assumption that there is indeed a single “ability score”. This should remind folks of IQ and the infamous g-factor. Like if we applied this reasoning to humans we would catch that this doesn’t make sense: just because someone performs well on a math test does not imply that they would perform well on a medical knowledge test: indeed it might even be the opposite. That said, there still is some latent factor in there that explains both. The question then becomes how explanatory this factor is and what if there’s actually a couple factors?
So let’s take a look at a dimensionality analysis of these benchmarks. We can check our model’s residuals: if there’s a single-factor then those residuals should be iid noise. If however, those residuals still contain structure we know there’s something else going on. Let’s look at the SVD values:
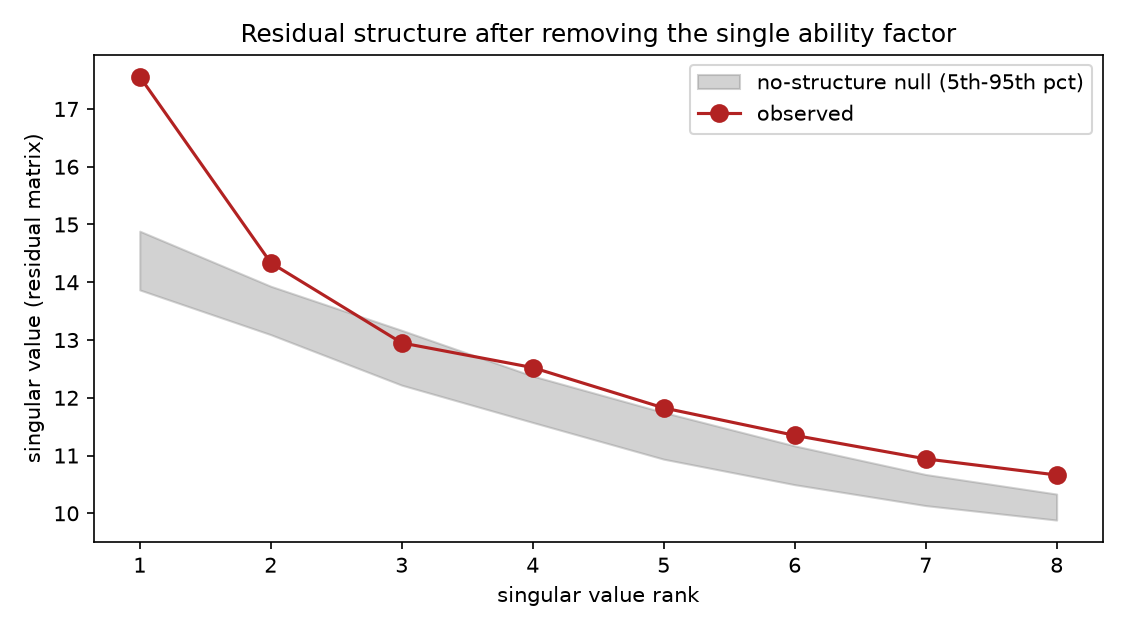
The top residual component sits well above anything the null distribution: there’s a real factor left over after the general ability factor. So what is it?
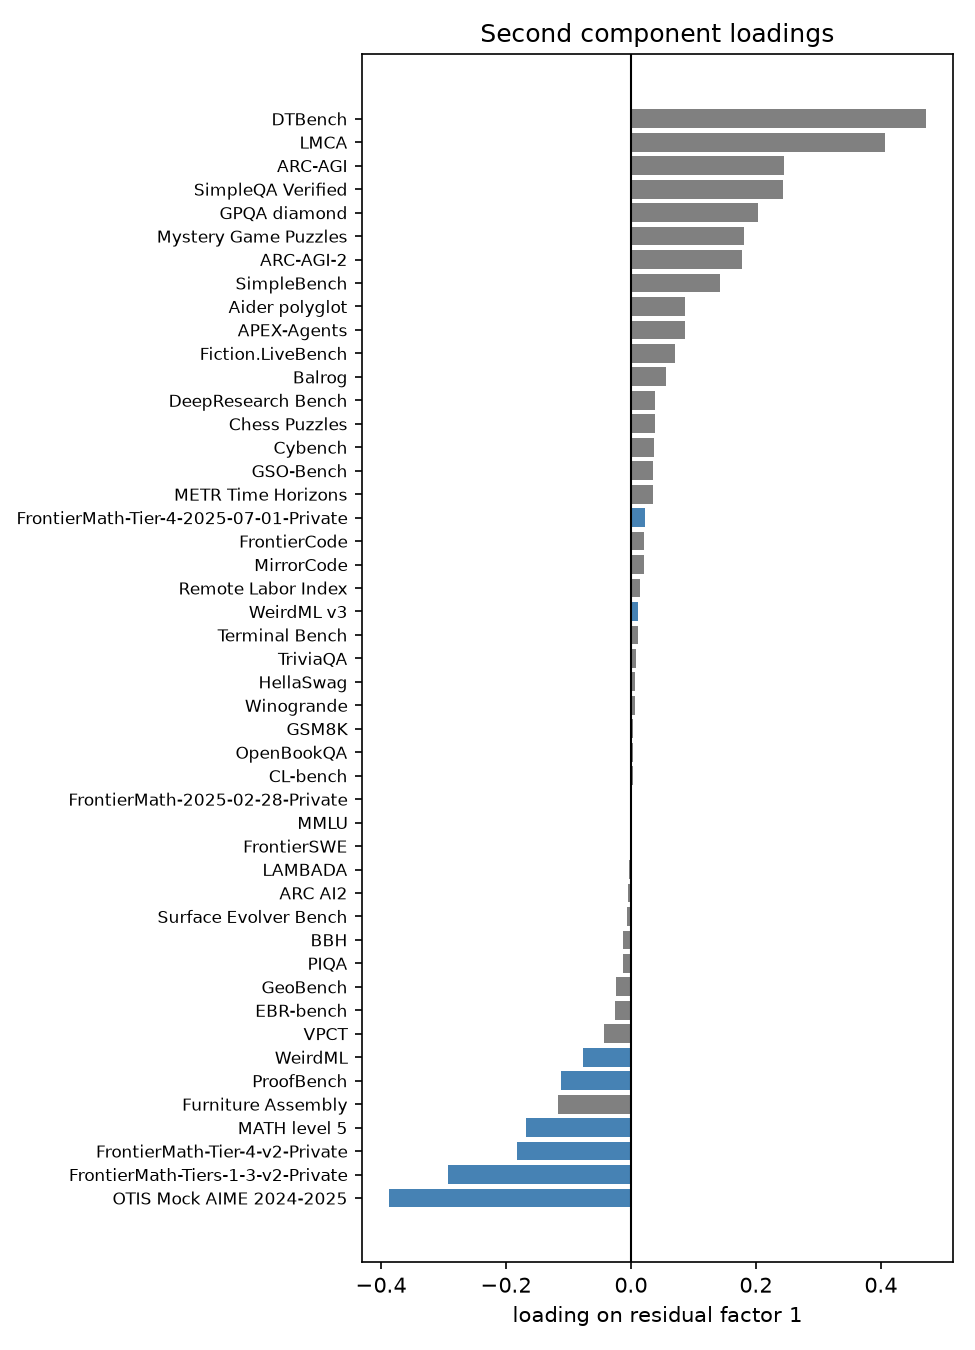
It looks like it’s everything other than math (that I have labelled blue)! The negative loading benchmarks are almost all math related and the positive loading benchmarks are all general knowledge / reasoning / coding related.
Note that the sign is interesting here: these are negative loadings. If something were to cause agents to become better at math then that would show up in the original loading: these additional structure is just needed to capture the residuals better. This hits particularly hard when we consider that reinforcement learning from verifiable rewards (RLVR) is in play: like we totally expect math to benefit from this while medicine will not.
Indeed when we restrict ourselves only to the math-loading cluster we see an acceleration ratio of 1.3 while the rest have an acceleration of 1.1.
Where does this leave us?
So we’ve replicated a version of METR’s acceleration claim. Do we believe it?
At the very least we can conclude that Anthropic’s latest models are likely5 better than their earlier models.
Aside from that it’s unclear how one would measure acceleration. As we’ve seen acceleration on ability scores presumes an interval scale for capability and no such scale is inherently implied by benchmark pass-rates. This simply isn’t something you can measure: it’s not that we need more data, it’s that we need different data. Only once we’ve seen more difficult benchmarks and how much we can trust these extrapolations will be truly know if anything has been accelerated.
The most damning analysis is this assumption of uniformity. Like it’s quite clear that math and other verifiable fields are being targeted. METR somewhat nods to this with their “well-specified tasks” language but even then they’re conflating between these math benchmarks and general knowledge benchmarks. Whether this actually speeds up model development isn’t particularly clear. I guess there’s probably some help from better math tooling but I suspect coding is far more useful and seems not to be connected as much. So recursive self-improvement? High skepticism
And this isn’t helped by the anecdata from their interview with researchers. Like you certainly have to discount due to the koolaid factor but it does seem that folks generally believe that using agentic coding is accelerating their work6. Not in a “it’s a supergenius in a datacenter” but rather it lets us throw more stuff at the wall. I find it fascinating that they don’t believe that additional resources is a large factor: like it’s quite plausible that they’re research insight constrained but still? I would think that the hardest constraint is just understanding what they actually did7. And I’m also surprised that nobody mentioned the RLVR bit. But what do I know: perhaps things were clearer in the redacted material.
-
This is unclear from the coverage and METR buries their acknowledgement quite far down into the report writing: “We believe there is significant risk that acceleration in AECI may not map cleanly to acceleration in real-world impact although, of course, they also hedge the other way: “If real-world impact is a convex function of benchmark scores, e.g. if impact depends on crossing a capability threshold, then AECI would understate real-world acceleration. In some domains we have seen a steady increase in benchmark scores accompanied by sudden accelerations in real-world impacts, e.g. impacts on the rate of discoveries in cybersecurity or math” ↩︎
-
Indeed they mention as such but then proceed to ignore these caveats
↩︎The 1.9x acceleration [95% confidence interval: 1.5–2.8x] in the AECI trend since October 2025 described below significantly informed this view, but could be explained by overfitting to the benchmark distribution or otherwise be an artifact of the AECI methodology.
-
They recognize that there are likely broken tasks and some ability to randomly guess and they adjust the results accordingly: basically scaling \([\text{random_chance}, 1 - \text{wrong_fraction}]\) to \([0,1]\). ↩︎
-
like the breakpoint selection, slope change, etc ↩︎
-
Aside from questions like “what if they’re overfitting to the benchmark” or (taking overfitting to an extreme) “the AI just stole the answers”, c.f. the OpenAI rogue agent breach of Hugging Face ↩︎
-
Keep in mind METR’s previous report showing that folks who believed AI was saving time were actually slower. ↩︎
-
One researcher says “When people present experiments, they most often just point to an [agent scaffold] thread” which strikes me as a nightmare. ↩︎